Business Dashboard Helps Teams Spot
KPIs 10x Faster

Business Dashboard unifies sales, revenue, and team KPIs so leaders detect trends and act immediately.
Trusted by revenue teams at



Live Report Library
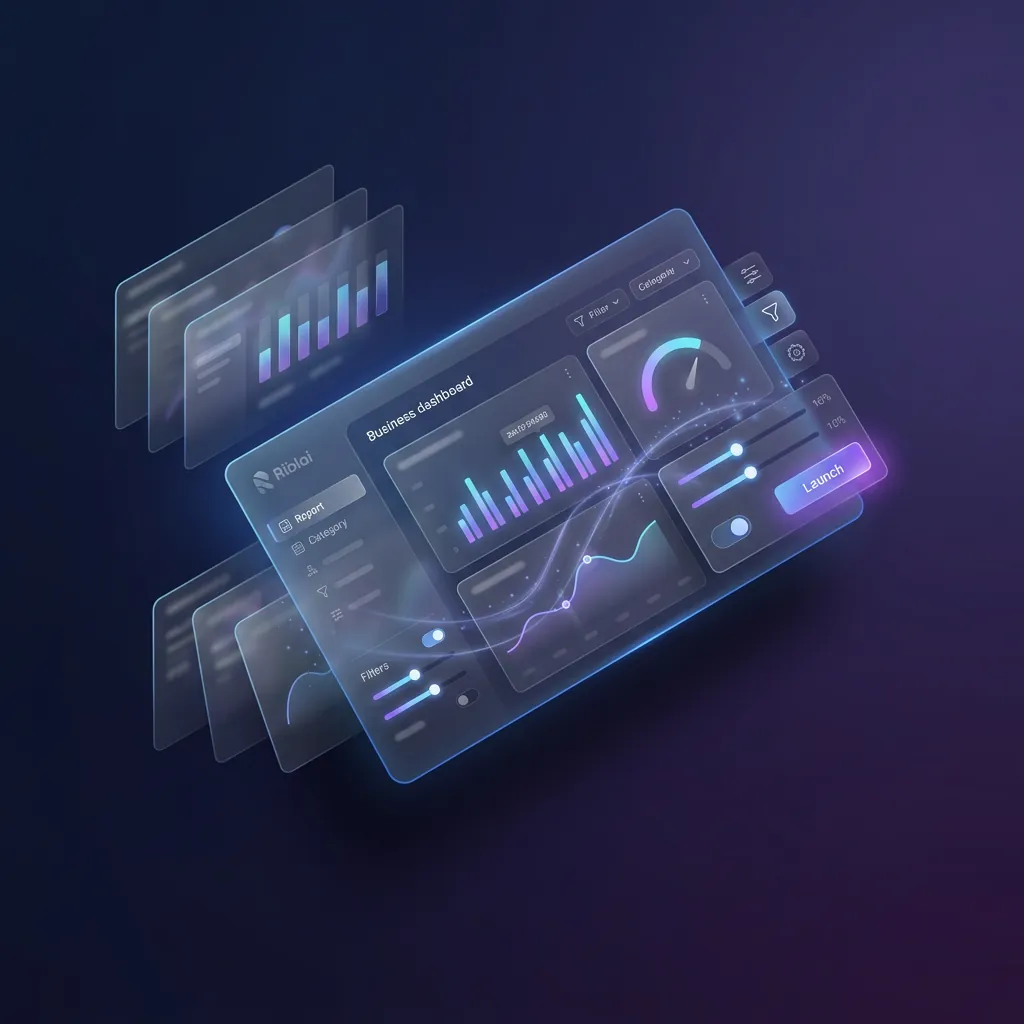
Launch seeded and custom reports with categories, charts, filters, and execution-ready parameters.
- Report catalog
- Custom dashboards
- Chart and table views
Campaign and Revenue View
Review sessions, contacts, deals, spend, and revenue in one connected performance view.
- Asset performance
- Campaign summaries
- Spend and revenue context

Flexible Dashboard Builder
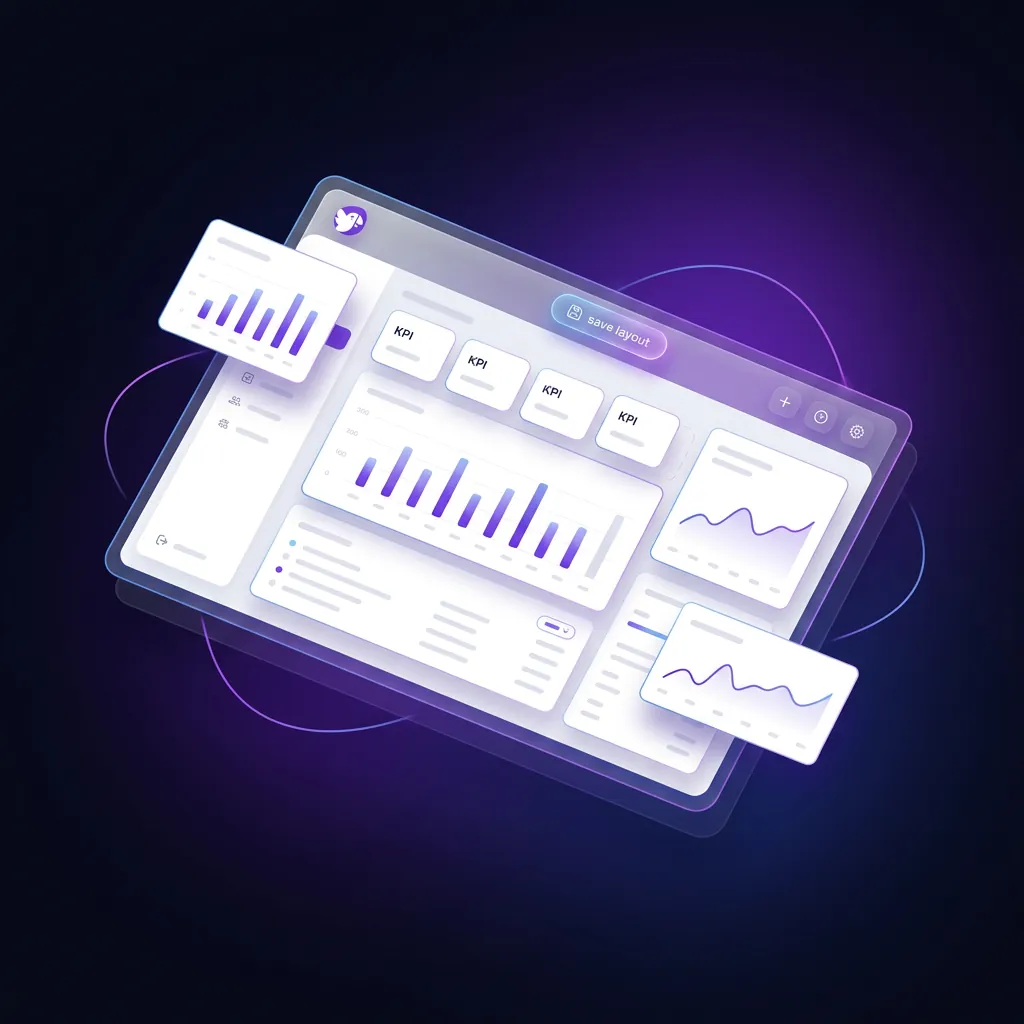
Assemble and save report layouts by team priority with default dashboard support.
- Saved dashboards
- Report selection
- Default layouts
Everything your revenue team needs
One workspace to capture, engage, and convert — across every channel your customers already use.

Hello John, I am doing well. How about you?


Hi! How are you doing?


Hey Mike, are you available for a meeting tomorrow?


Hi Jane, I am doing well. How about you?

Hello John, I am doing well. How about you?
Hi! How are you doing?
Omnichannel Inbox
Manage Live Chat, WhatsApp, Messenger, and Instagram conversations from one unified inbox.
Open the inbox

Full Customer Attribution
From first impression to loyal customer, every interaction connected (website visits, chats, deals, sales activity..).
See attribution systemPipeline Growth
+0%
+2.1% today
AI Replies
0
+64 in 1h
Qualified Leads
0
steady
Pipeline Growth
+0%
+2.1% today
AI Replies
0
+64 in 1h
Qualified Leads
0
steady
Pipeline Growth
+0%
+2.1% today
AI Replies
0
+64 in 1h
Qualified Leads
0
steady
Pipeline Growth
+0%
+2.1% today
AI Replies
0
+64 in 1h
Qualified Leads
0
steady
Win Rate
0%
+0.7%
Avg. Response
0s
-5s
Open Deals
0
+4
Win Rate
0%
+0.7%
Avg. Response
0s
-5s
Open Deals
0
+4
Win Rate
0%
+0.7%
Avg. Response
0s
-5s
Open Deals
0
+4
Win Rate
0%
+0.7%
Avg. Response
0s
-5s
Open Deals
0
+4
AI Reports & Analytics
Ask AI any question about your data. Track deals, conversion rates, and team performance in real time. Connect every chat to a revenue outcome.
View analyticsOnline Visitors
Break the ice by speaking to your website visitors in real time. Full contact profiles with chat history, deal context, and custom fields — built for revenue teams.
Explore Online VisitorsWhy Choose Ribl.ai
Give every team a focused reporting workspace.
Combine attribution and performance in one view.
Make reporting reusable instead of one-off.
Support both chart and table review.
Frequently Asked Questions
Yes. Dashboards store selected report IDs and ordering.
Yes. Reports define display columns and chart configuration.
Yes. Campaign and interaction models expose performance summaries and breakdowns.
See how Business Dashboard Helps Teams Spot KPIs 10x Faster turns data into faster, clearer business decisions. Book a demo to explore it.
Book a demo